eruptions <- c(1492, 1585, 1646, 1677, 1712, 1949, 1971, 2021)
n_eruptions <- length(eruptions)1 Introduction
Introduction and Motivation: What is the problem you are trying to solve? Why is this problem interesting? What has been tried before? What have been the shortcoming of those approaches that necessitate your efforts? Often, this section will conclude with a subsection (or paragraph) outlining “our contributions.” What is the new knowledge that this paper contributes?
In [1]:
In [2]:
In [3]:
avg_years_between_eruptions <- mean(diff(eruptions[-n_eruptions]))
avg_years_between_eruptions
[1] 79.83333Based on data up to and including 1971, eruptions on La Palma happen every 79.8 years on average.
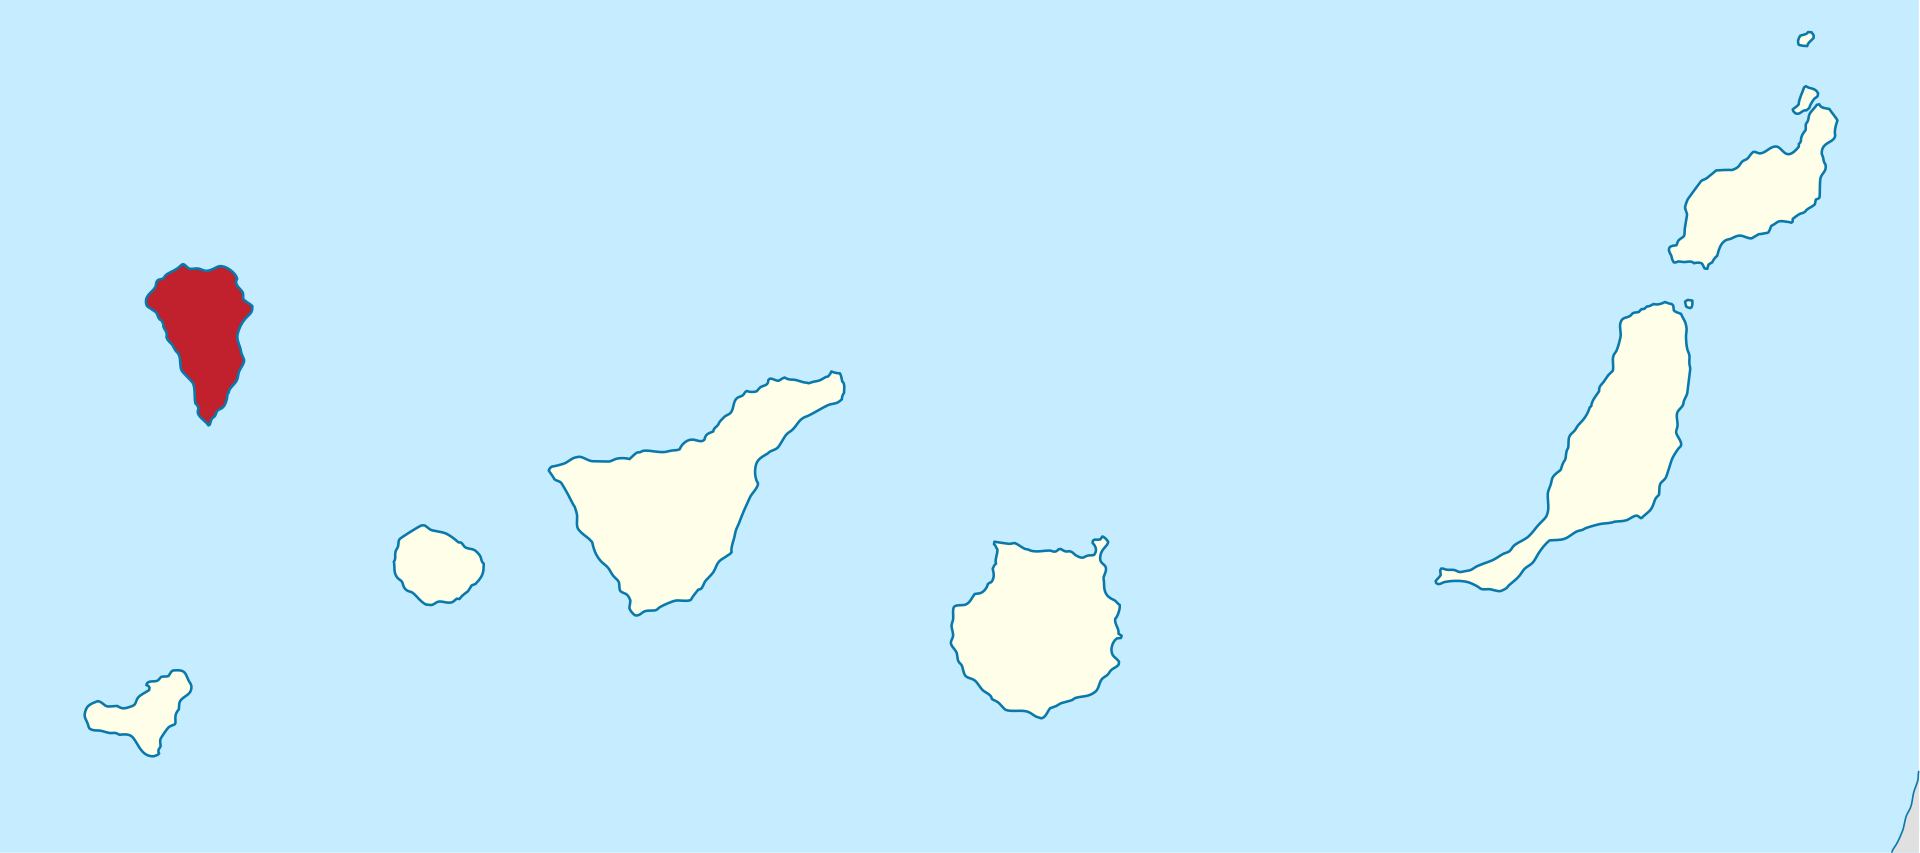
La Palma is one of the west most islands in the Volcanic Archipelago of the Canary Islands (Figure 2).
1.1 Relevant work
Studies of the magma systems feeding the volcano, such as Marrero et al. (2019), have proposed that there are two main magma reservoirs feeding the Cumbre Vieja volcano; one in the mantle (30-40km depth) which charges and in turn feeds a shallower crustal reservoir (10-20km depth).
Eight eruptions have been recorded since the late 1400s (Figure 1).
1.2 Our contribution
Data and methods are discussed Section 2 and Section 3, respectively.
2 Data
Data: Where did it come from? What are some basic summary statistics, variable definitions, and/or visualizations that help the reader understand the data you are working with?
Read a clean version of data:
In [4]:
library(tidyverse)── Attaching core tidyverse packages ──────────────────────── tidyverse 2.0.0 ──
✔ dplyr 1.1.4 ✔ readr 2.1.5
✔ forcats 1.0.0 ✔ stringr 1.5.1
✔ ggplot2 3.5.1 ✔ tibble 3.2.1
✔ lubridate 1.9.3 ✔ tidyr 1.3.1
✔ purrr 1.0.2
── Conflicts ────────────────────────────────────────── tidyverse_conflicts() ──
✖ dplyr::filter() masks stats::filter()
✖ dplyr::lag() masks stats::lag()
ℹ Use the conflicted package (<http://conflicted.r-lib.org/>) to force all conflicts to become errorsla_palma <- read_csv(here::here("data/la-palma.csv"))Rows: 11347 Columns: 5
── Column specification ────────────────────────────────────────────────────────
Delimiter: ","
dbl (4): Longitude, Latitude, Depth(km), Magnitude
dttm (1): DateTime
ℹ Use `spec()` to retrieve the full column specification for this data.
ℹ Specify the column types or set `show_col_types = FALSE` to quiet this message.Create spatial plot:
In [5]:
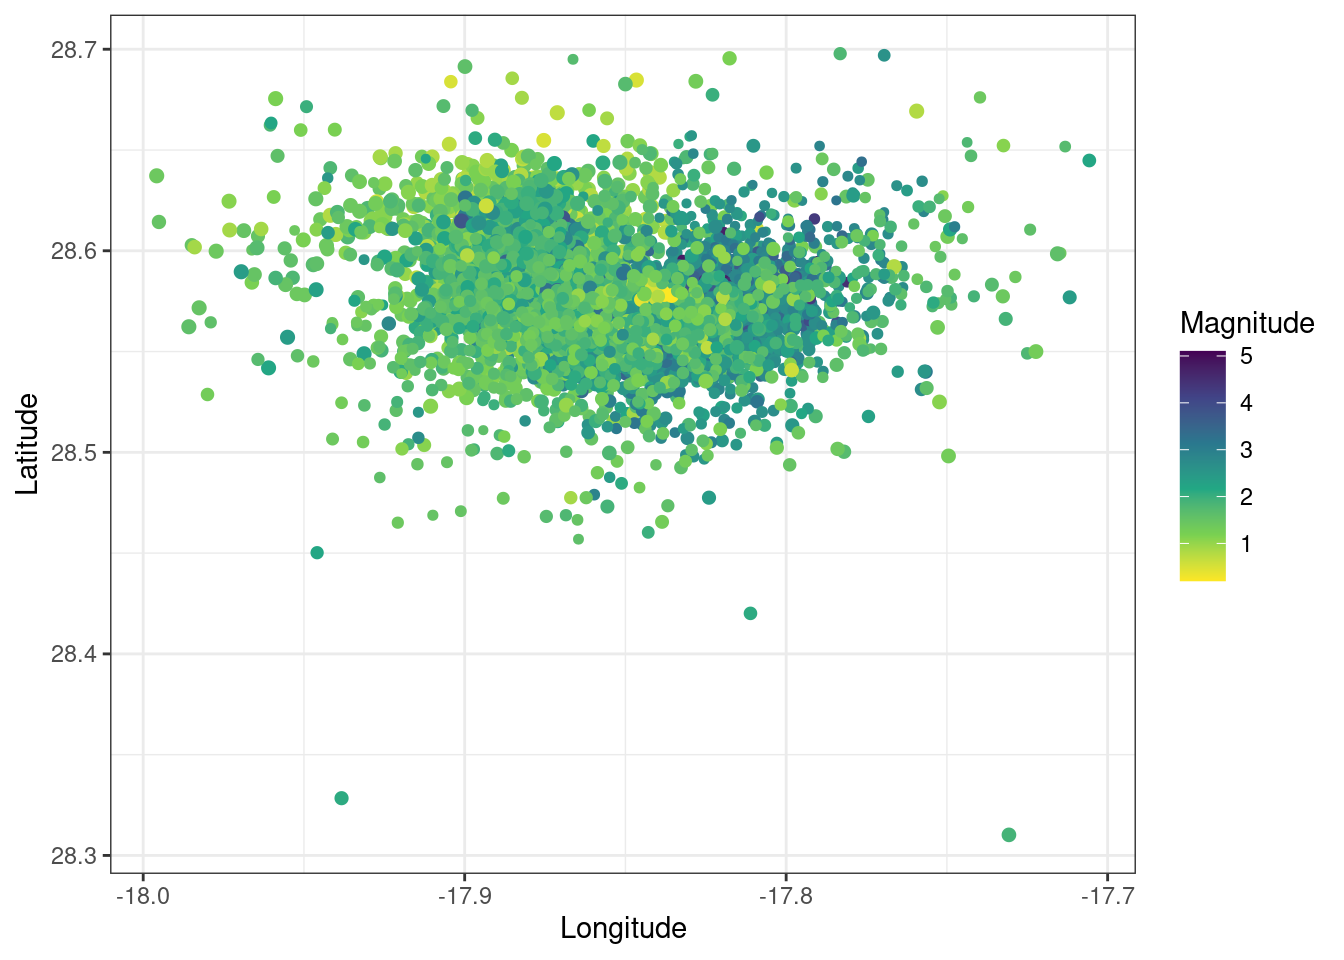
Figure 3 shows the location of recent Earthquakes on La Palma.
3 Methods
Methods: What did you actually do? What techniques or methods did you employ? What were the specifications for any statistical models you used? What software or packages did you use or develop?
Let \(x\) denote the number of eruptions in a year. Then, \(x\) can be modeled by a Poisson distribution
\[ p(x) = \frac{e^{-\lambda} \lambda^{x}}{x !} \tag{1}\]
where \(\lambda\) is the rate of eruptions per year. Using Equation 1, the probability of an eruption in the next \(t\) years can be calculated.
| Name | Year |
|---|---|
| Current | 2021 |
| Teneguía | 1971 |
| Nambroque | 1949 |
| El Charco | 1712 |
| Volcán San Antonio | 1677 |
| Volcán San Martin | 1646 |
| Tajuya near El Paso | 1585 |
| Montaña Quemada | 1492 |
Table 1 summarises the eruptions recorded since the colonization of the islands by Europeans in the late 1400s.
4 Results
Results: What did you learn about the problem you identified in Section 1? This is where you put the tables, figures, and analytics by-products of your work.
5 Conclusion
Conclusion: What are the limitations of your work? What are some next steps that someone (either you or another research group) should consider in attempting to further your work? Remind us one last time about what you did.
5.1 Limitations
5.2 Future work
5.3 Final thoughts
6 Ethical statement
Drawing on what you have learned about data science ethics in this class, discuss any ethical considerations in your project. For some projects, this statement could be quite short (one paragraph may suffice). For other projects, more detail may be needed (no more than 2 pages).
Be expansive and creative in your thinking about possible ethical considerations. One way to do this assignment poorly would be to write a short statement asserting that there are no ethical considerations, only to have me think of several fairly obvious ones.
7 Acknowledgements
Were there any people or organizations who helped you that you would like to acknowledge?
References
References: Every reference (except for books) needs a DOI (strongly preferred) or URL. Use Google Scholar to help with BibTeX. Every book needs publisher location (e.g. “City, ST: Publisher”). 🙄 See SDS 100: Bibliographies


